Updated for Q1 2025: Kaiko Spot Exchange Ranking

Implied Volatility for Crypto Assets
How to use Kaiko’s IV data for better risk management.
(5 min read) This case study explores the background, methodology, and use case for implied volatility, available with Kaiko's Derivatives Risk Indicators solution.
Overview
One of the best ways of determining risk in financial markets is by calculating the implied volatility of an option. Implied volatility is a forward-looking measure of the expected volatility of an asset over a specified time period, derived from the market price of the option contract. It is an extremely useful tool for forecasting risk, but the distinct characteristics of crypto markets makes the computation uniquely complex.
Crypto Options Markets
Crypto options markets often have low trade volumes, missing quotes, and large bid/ask spreads, which makes determining a precise and sturdy measure for implied volatility (IV) over time a complex task. Further, existing measures lack transparency with unclear methodologies. Today, only BTC and ETH have option markets are developed enough to determine a precise measure for IV.
To solve for the challenges faced by option traders, Kaiko built a methodology specifically tailored for crypto markets, providing accurate, robust and stable implied volatilities for any crypto option strike and expiry.
With our methodology, IV is derived from the option market price for all strikes and expiries.
✓ volatilities updated every hour to capture market changes
✓ designed to be efficient in case of liquidity issues, accommodating for missing data
✓ space interpolation for non-listed strikes
✓ statistically more robust when compared with existing IV methodologies
READ OUR LATEST IMPLIED VOLATILITY REPORT
What is implied volatility and why does it matter?
How was implied volatility impacted by recent market events?
How you can use Kaiko Implied Volatility to manage options risk?
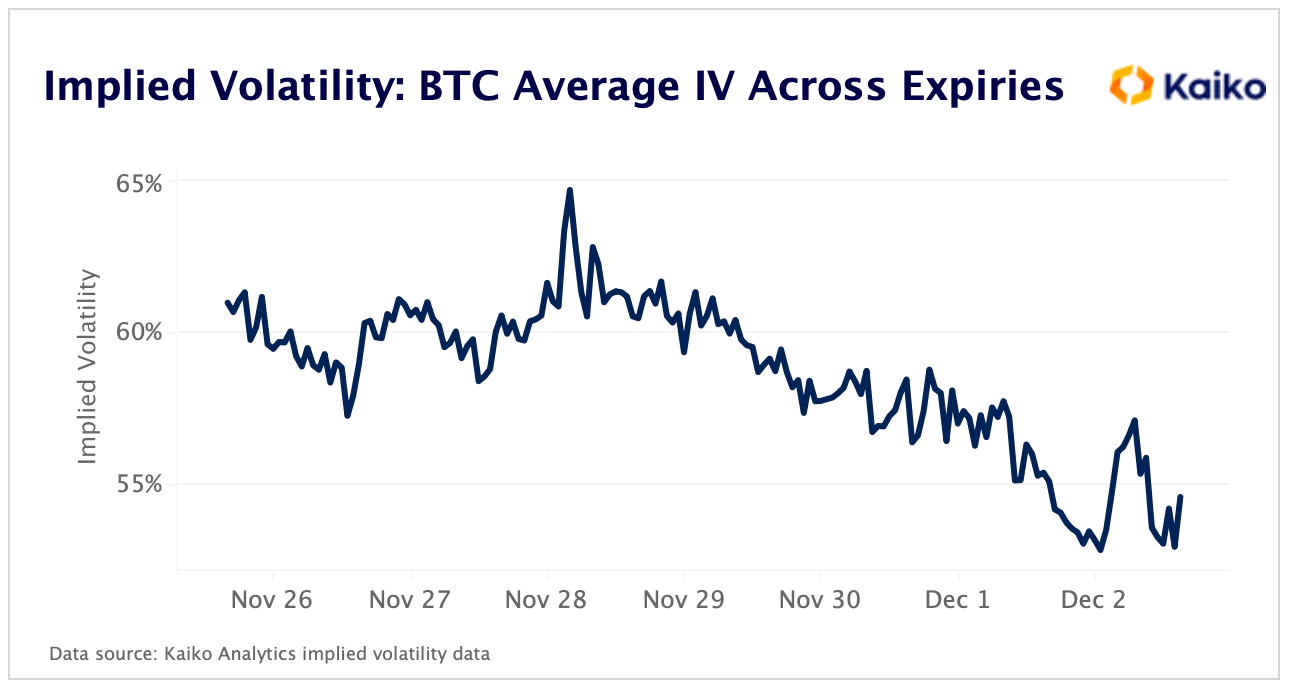
Implied Volatility for Different Expiries
Having a sense of how much volatility is expected over the coming days, weeks and months allows investors to implement more robust risk management strategies. Looking at a range of expiries can give a general sense of the expected volatility of an asset, rather than looking at one specific time period.
In the below example, we take the average IV for all BTC option expiries that are at-the-money, and can observe a sharp drop from 64% to 54%, which suggests that BTC markets are calming down.
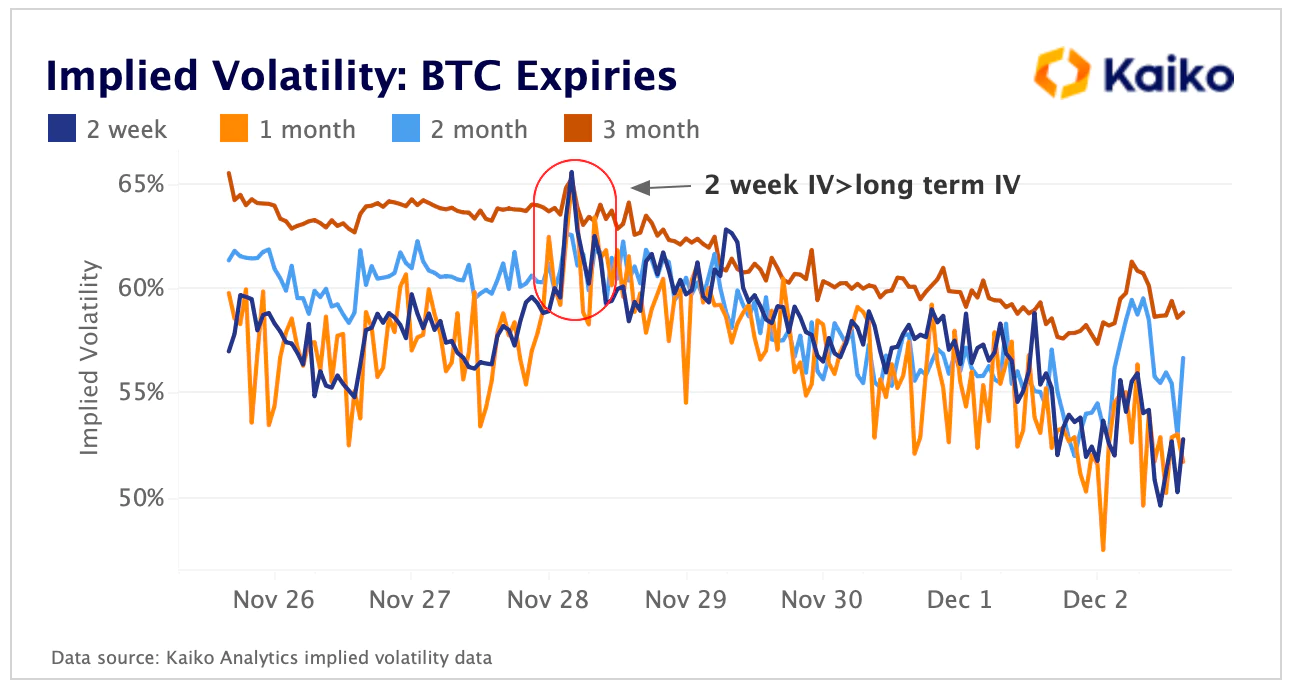
Different expiries have different measures for IV, which can help traders understand future risk. An inverted structure, in which short-term implied volatility is greater than the longer-term gauges, signals panic in the markets.
We saw this happen on November 28th, when the 2 week implied volatility for at-the-money options was greater than the 3, 2 and 1 month implied volatility for the same strikes. An inverted structure would mark a good time for a risk manager to reduce their market exposure and de-risk positions. A normal market structure for implied volatility would see the longer dated expiries have higher IV as more volatility should be expected over a longer timeframe.
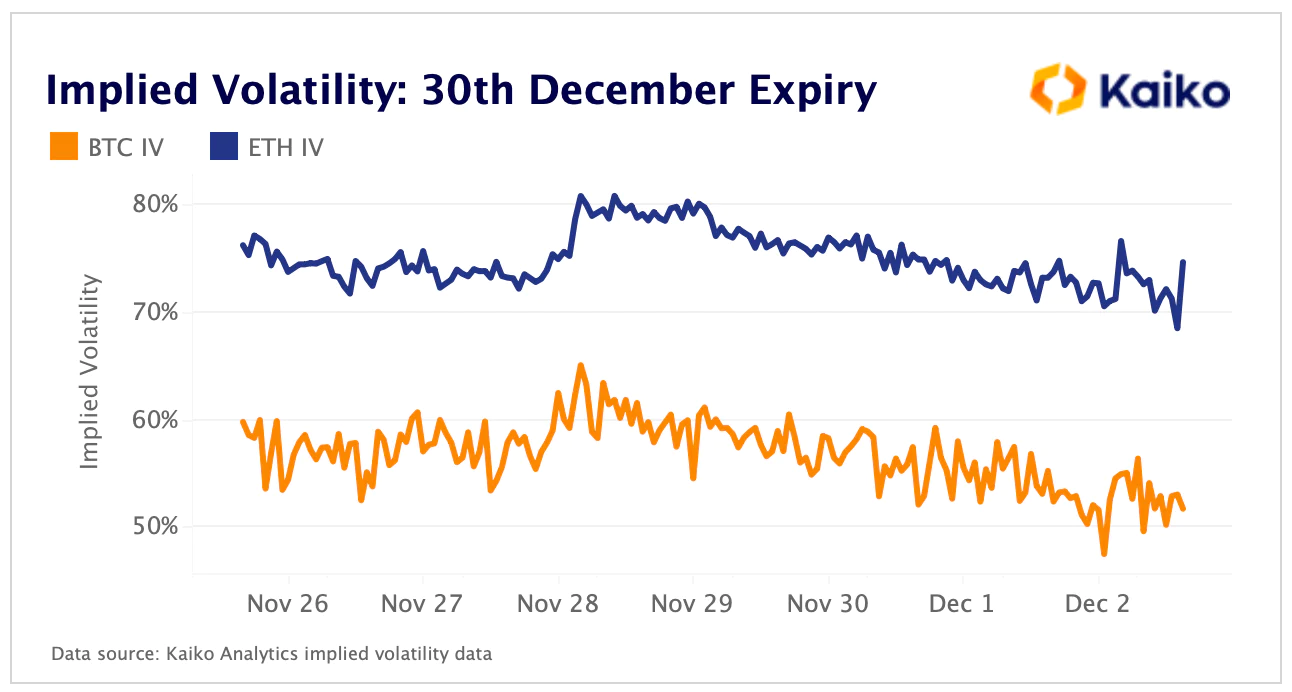
Implied Volatility for One Expiry
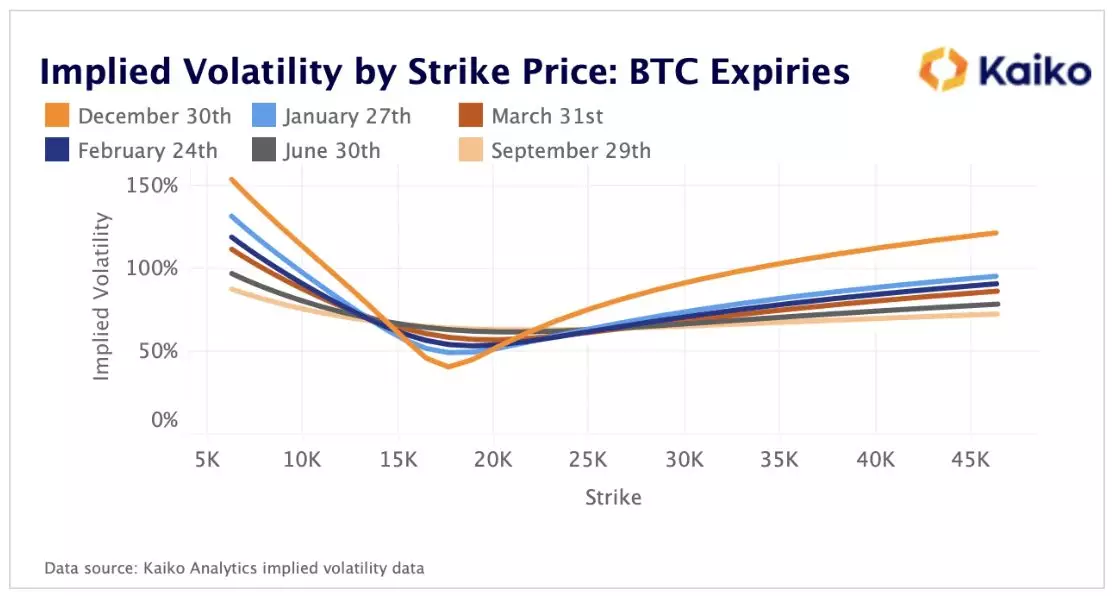
Implied Volatility for Different Strike Prices
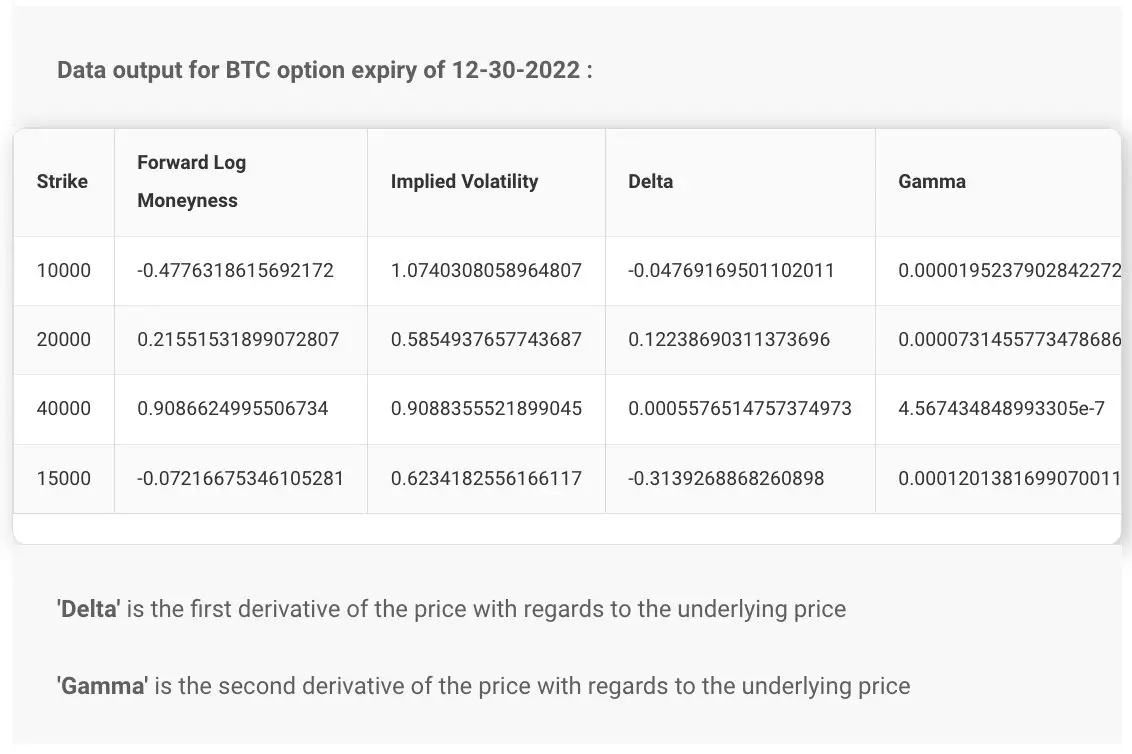
How to Use Our IV
Conclusion
Analysis of implied volatility and its dynamics are important information in options trading, derivative risk management and even spot market analysis. The lesson learned from the FTX collapse, if not the whole of 2022, should be that risk management is a necessity going forward in crypto. Implied volatility and other metrics such as VaR and market liquidity can form the foundations of a well-rounded risk management toolkit.
Ready to Get Started?
We serve 200+ enterprise clients worldwide, from financial institutions to crypto-native enterprises. Learn how you can benefit from Kaiko today.
